Progress
Waist to Height Ratio Calculator: The Half-Your-Height Test
Free waist to height ratio calculator. See your WHtR on NICE's 0.4, 0.5 and 0.6 bands, the waist that keeps you under half your height, and how to measure.

Enter your height and waist to get your waist-to-height ratio (WHtR), where it falls on the bands the UK's National Institute for Health and Care Excellence (NICE) uses, and the waist size that would keep you under half your height. It updates as you type and runs entirely in your browser.
Waist-to-height ratio = waist ÷ height, both in the same units. Example: a 34 in waist and a 5 ft 7 in (67 in) height give 34 ÷ 67 = 0.50.
NICE bands for adults: 0.4 to 0.49 healthy central adiposity; 0.5 to 0.59 increased; 0.6 or more high. To stay under 0.5, keep your waist to less than half your height: for 67 in tall, under 33.5 in.
Turn on JavaScript to use the interactive calculator.
How the waist-to-height ratio works
The formula is one division:
WHtR = waist circumference ÷ height
Use the same units for both, inches with inches or centimeters with centimeters. Because it's a ratio, the units cancel out and the answer is identical either way: a 34-inch waist at 67 inches tall is 0.507, and the same person measured as 86.4 cm and 170.2 cm also gets 0.507. The calculator cuts the result to two decimals instead of rounding, to match NICE's bands ("0.5 to 0.59"): 0.507 reads 0.50 and 0.499 reads 0.49.
Why divide by height at all? Waist circumference on its own is a good signal of fat stored around the abdomen, but a 34-inch waist means something different on someone who is 5 ft 2 in than on someone who is 6 ft 3 in. Dividing by height adjusts for frame size with no charts, no age or sex tables, and no weight.
Nutrition scientist Margaret Ashwell has argued for the measure for two decades. Her 2005 paper set out the simple public health message: keep your waist circumference to less than half your height, with a single 0.5 boundary for men, women and different ethnic groups. A 2012 systematic review and meta-analysis by Ashwell and colleagues, pooling studies of more than 300,000 adults, found WHtR was better than both waist circumference and BMI at picking out people with diabetes, high blood pressure and cardiovascular risk factors.
What your result means
In 2022 NICE added waist-to-height ratio to its guidance on identifying and assessing overweight and obesity, now guideline NG246. It classifies central adiposity (fat around the middle) like this:
| Waist-to-height ratio | NICE classification | What NICE says it indicates |
|---|---|---|
| 0.4 to 0.49 | Healthy central adiposity | No increased health risks |
| 0.5 to 0.59 | Increased central adiposity | Increased health risks |
| 0.6 or more | High central adiposity | Further increased health risks |
The risks NICE names are type 2 diabetes, high blood pressure and cardiovascular disease. Its plain-language advice is to "keep their waist to less than half their height", which is the boundary at 0.5.
A few details matter when you read your number:
- The bands apply to adults with a BMI under 35, of both sexes and all ethnicities. NICE explicitly includes adults with high muscle mass, one group that BMI tends to misclassify.
- Below 0.4 isn't a NICE band. The guidance doesn't classify it. A very low ratio can go with being underweight, so if that applies to you, it's a conversation for a clinician rather than a calculator.
- The boundaries are not cliffs. Risk rises gradually; 0.49 and 0.51 are close to each other in every sense except the label.
- It is a screen. NICE's guidance is that a ratio of 0.5 or more is a reason to seek further assessment, such as a cardiometabolic risk check, not a diagnosis in itself.
In Ashwell's later analysis of UK survey data, about a third of adults judged "no increased risk" by BMI and waist size together had a WHtR of 0.5 or more, and that group had measurably worse cardiometabolic risk factors than people with the same healthy BMI and a lower ratio.
Ideal waist size for your height
The left column is where the healthy band starts (0.4); the right is the waist to stay under (0.5).
| Height | Healthy band starts (0.4 × height) | Keep waist under (0.5 × height) |
|---|---|---|
| 4 ft 11 in (150 cm) | 23.6 in (59.9 cm) | 29.5 in (74.9 cm) |
| 5 ft 0 in (152 cm) | 24.0 in (61.0 cm) | 30.0 in (76.2 cm) |
| 5 ft 2 in (157 cm) | 24.8 in (63.0 cm) | 31.0 in (78.7 cm) |
| 5 ft 4 in (163 cm) | 25.6 in (65.0 cm) | 32.0 in (81.3 cm) |
| 5 ft 6 in (168 cm) | 26.4 in (67.1 cm) | 33.0 in (83.8 cm) |
| 5 ft 7 in (170 cm) | 26.8 in (68.1 cm) | 33.5 in (85.1 cm) |
| 5 ft 8 in (173 cm) | 27.2 in (69.1 cm) | 34.0 in (86.4 cm) |
| 5 ft 10 in (178 cm) | 28.0 in (71.1 cm) | 35.0 in (88.9 cm) |
| 6 ft 0 in (183 cm) | 28.8 in (73.2 cm) | 36.0 in (91.4 cm) |
| 6 ft 2 in (188 cm) | 29.6 in (75.2 cm) | 37.0 in (94.0 cm) |
| 6 ft 4 in (193 cm) | 30.4 in (77.2 cm) | 38.0 in (96.5 cm) |
Your waist here is the body measurement, not your pants size. Jeans usually sit lower, on the hips, and brands label sizes generously, so a "32" pair often measures more than 32 inches.
How to measure your waist
Where you put the tape changes the number by an inch or more, so the method matters more than the tape.
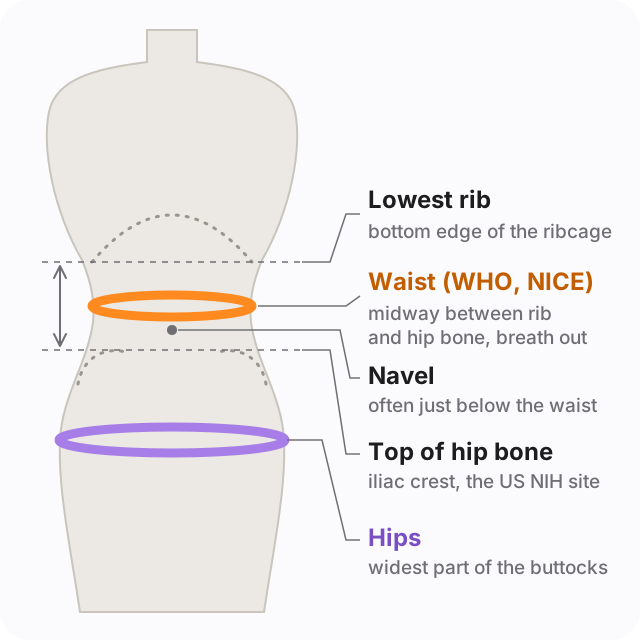
- Find your landmarks. Standing, press your fingers into your side to find the bottom edge of your ribcage, then the top of your hip bone (the iliac crest) below it.
- Wrap the tape halfway between them. For most people this sits just above the belly button. Keep the tape level all the way round; a mirror or a second person helps check the back.
- Breathe out normally, then read. Don't suck in or push out. Measure at the end of a relaxed breath out, with the tape snug but not pressing into the skin.
- Measure twice. If the two readings are within 1 cm (about ⅜ in), use the average. If not, measure again.
Measure your height barefoot, standing straight against a wall, and mark the top of your head with something flat like a hardcover book.
Which waist site to use
The three common waist sites aren't interchangeable (WHO expert consultation report):
- Midway between the lowest rib and the top of the hip bone. The WHO STEPS protocol, and the method NICE tells people to use at home. It's anatomical, so it lands in the same place on any body.
- Top of the hip bone. The protocol in the US NIH's practical guide to obesity and the NHANES survey. It sits lower than the midpoint, and on many people it reads larger.
- At the navel. Easy to find, but the navel's position varies between people and moves as the belly changes. It can underestimate the true waist.
Use the midpoint: the bands come from research that mostly measured there. For tracking your own progress, consistency matters most: same site, same time of day (morning, before eating), same tape.
Why your waist is one of the best progress markers
Scale weight moves with water, food and salt, sometimes by several pounds in a day. Your waist is steadier, and it measures the thing most people are trying to change: fat around the middle. A 2020 consensus statement in Nature Reviews Endocrinology called waist circumference a vital sign that clinicians should measure routinely, and noted that exercise- or diet-driven reductions in waist circumference "are observed with or without weight loss".
That's why a waist that drops while the scale is stuck is often real progress, not noise. If the scale has stalled, our guide to a weight loss plateau explains how to tell a true stall from water and how to read your waist alongside it. If you're on a GLP-1 medication, tracking GLP-1 progress with photos covers measuring and photographing change when weight comes off quickly.
A practical routine:
- Measure your waist once a week, same morning, same method. Look at the trend over four weeks, not single readings.
- Recalculate your ratio monthly. Your height doesn't change, so every 1 cm off your waist at 170 cm tall lowers the ratio by about 0.006.
- Pair the tape with photos. A tape gives you one number at one height; a front and side photo shows where the change happened. Our guide to taking progress photos covers the setup.
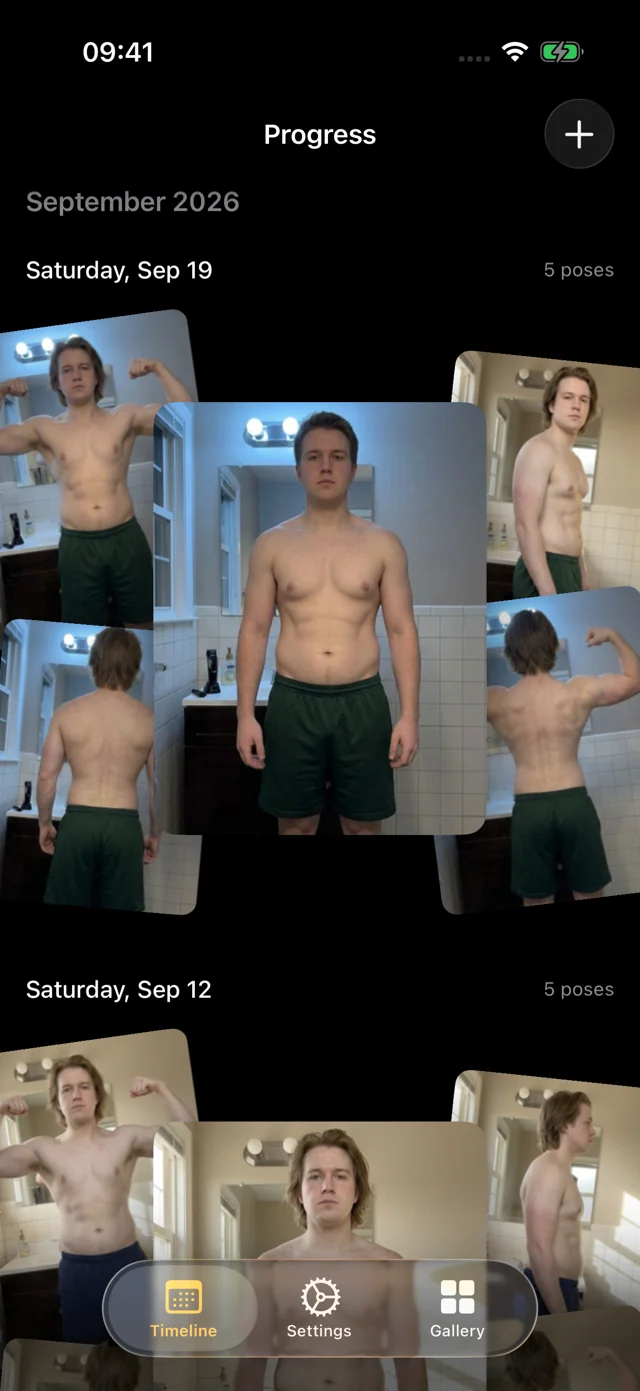
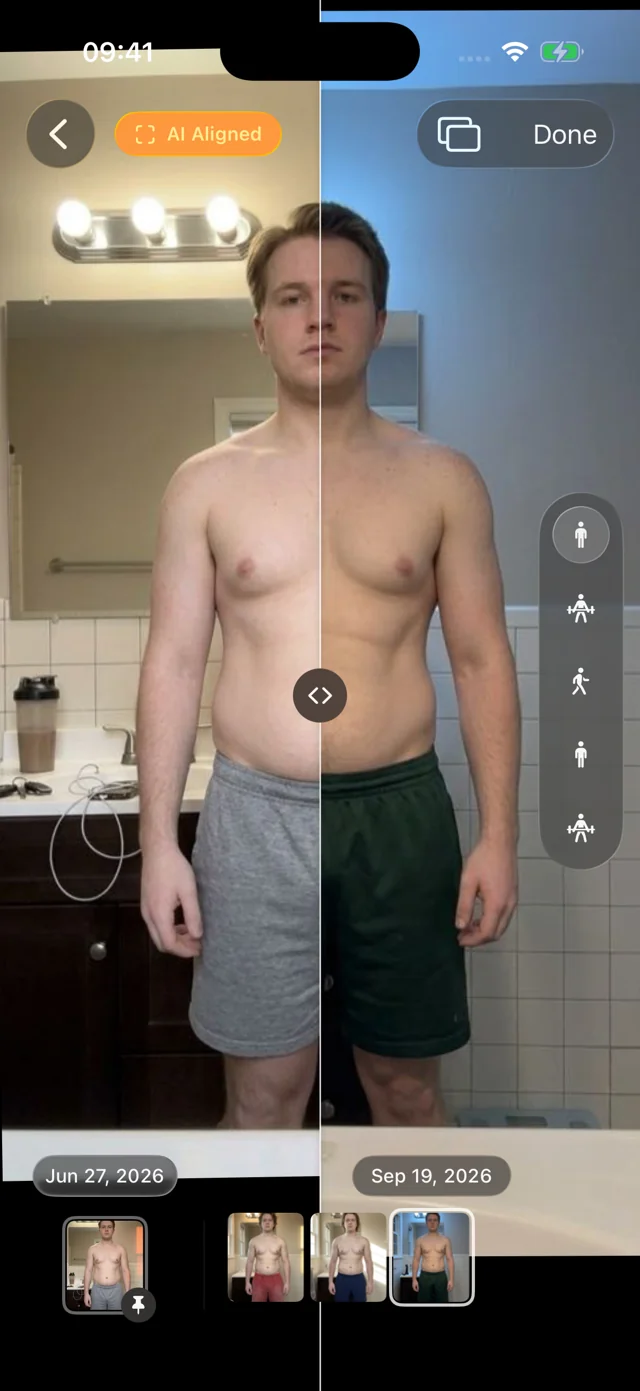
Progress is the iPhone app we make for that second part: it lines up every photo automatically, so a change around your waist is easier to see when you compare weeks side by side.
Limits of waist-to-height ratio
- It doesn't measure fat directly. A larger waist can come from fat under the skin, fat around the organs, bloating, or posture. Scans like DEXA separate these; a tape can't.
- Measurement error is real. A tape placed 2 cm lower, or measured after a big meal, can shift your ratio by 0.01 or more. That's why the trend is more useful than one reading.
- It isn't for everyone. NICE's adult bands don't cover pregnancy, and they apply to people with a BMI under 35. Children's growth needs different interpretation.
- It's one input. Blood pressure, blood sugar, cholesterol, family history and activity all matter. A clinician can put the number in context.
Want a second view of your shape? Our waist-to-hip ratio calculator compares your waist with your hips against the World Health Organization's cut-offs.
FAQ
What is my ideal waist size for my height?
Under half your height, by the NICE and Ashwell guidance. Divide your height by two: at 5 ft 7 in (67 in), that's a waist under 33.5 inches; at 170 cm, under 85 cm. The NICE healthy band runs from 0.4 to 0.49 times your height.
What should my waist be at 5'7"?
Under 33.5 inches (85.1 cm) to keep a waist-to-height ratio below 0.5. The NICE healthy range at that height starts at about 26.8 inches (68.1 cm).
Is a 32 inch waist unhealthy?
It depends on your height. A 32-inch waist is exactly half the height of someone who is 5 ft 4 in (64 in), a ratio of 0.50, at the start of NICE's increased band. On someone 6 ft tall, it's a ratio of 0.44, in the healthy band.
What is the Air Force's waist-to-height ratio?
The US Air Force replaced its old abdominal tape test with a waist-to-height ratio announced in January 2023. Its standard is a ratio that does not exceed 0.55, with the waist measured midway between the lowest rib and the top of the hip bone. That is a fitness-program standard; the health bands NICE uses start at 0.5.
Is waist-to-height ratio better than BMI?
For spotting cardiometabolic risk, research suggests so. Ashwell's 2012 meta-analysis found WHtR discriminated risk better than BMI and waist circumference. BMI can't tell where weight is carried; WHtR targets abdominal fat. Many clinicians still use both together.