Progress
FFMI Calculator: Fat-Free Mass Index and Natural Limit
Free FFMI calculator: get your raw and normalized fat-free mass index, ranges for men and women, and what the natural limit of 25 really means.
This FFMI calculator turns your height, weight and body fat percentage into your fat-free mass index: how much non-fat mass you carry for your height. It shows both the raw and the height-normalized FFMI, places you against published reference points, and tells you how much lean mass the next range would take.
Everything is calculated in your browser, and the link in your address bar updates so you can bookmark or share your numbers.
How the FFMI calculator works: fat-free mass (kg) = weight (kg) × (1 − body fat % ÷ 100). FFMI = fat-free mass ÷ height (m)². Normalized FFMI = FFMI + 6.1 × (1.8 − height in m).
Example: 5′10″ (1.778 m), 180 lb (81.6 kg), 18% body fat → fat-free mass 67.0 kg → FFMI 21.2, normalized 21.3.
Typical young adult medians are about 18.9 for men and 15.4 for women. A normalized FFMI of 25 was the upper limit in one 1995 study of drug-free male athletes. Turn on JavaScript to use the interactive calculator.
Key takeaways
- FFMI is fat-free mass divided by height squared: a BMI that ignores fat.
- The median for adults aged 18–34 is about 18.9 for men and 15.4 for women.
- The “natural limit” of 25 comes from one 1995 study of male athletes; later studies found plenty of athletes above it.
- Body fat error matters most: 5 points of body fat moves FFMI by more than one full point.
What is FFMI?
Fat-free mass index (FFMI) is your fat-free mass in kilograms divided by your height in meters squared. Fat-free mass is everything that isn’t fat: muscle, bone, organs, water and connective tissue.
It works like BMI with the fat removed. BMI can’t tell a 200 lb lifter from a 200 lb person who has never trained; FFMI can, because it only counts the lean part. That makes it a useful single number for one question: how much lean mass do I carry for my height?
The medians come from bioimpedance measurements of 5,635 Swiss adults (Schutz et al., 2002); the 25.0 figure from Kouri et al. (1995).
The FFMI formula
The calculator runs three steps:
- Fat-free mass (kg) = weight (kg) × (1 − body fat % ÷ 100)
- FFMI = fat-free mass (kg) ÷ height (m)²
- Normalized FFMI = FFMI + 6.1 × (1.8 − height in m)
US units are converted first (1 lb = 0.4536 kg, 1 in = 2.54 cm).
Worked example. A man who is 5′10″ (1.778 m), weighs 180 lb (81.6 kg) and has 18% body fat:
- Fat-free mass = 81.6 × 0.82 = 67.0 kg (147.6 lb)
- FFMI = 67.0 ÷ 1.778² = 67.0 ÷ 3.161 = 21.2
- Normalized FFMI = 21.2 + 6.1 × (1.8 − 1.778) = 21.2 + 0.13 = 21.3
Why “normalized” FFMI?
Taller people carry a little more lean mass per square meter of height, so raw FFMI slightly favors them. Kouri and colleagues added a small correction that adjusts every result to the height of a 1.80 m (5′11″) man. Below 1.80 m the correction adds to your score; above, it subtracts. It’s small: about 0.6 points per 10 cm.
Some sources use 6.3 instead of 6.1; the difference is under 0.05 points for almost everyone. The correction was derived from men, so the calculator places women by raw FFMI.
What is a good FFMI?
There’s no single “good” number; it depends on your sex, age, training history and goals. The ranges below are anchored on two reference points: the population median and the upper limit in Kouri’s drug-free athletes.
| Range (men, normalized) | Range (women, raw) | What it usually means |
|---|---|---|
| Below 18 | Below 14.5 | Less lean mass than most adults; untrained beginners often start here |
| 18–20 | 14.5–16.5 | Typical for adults |
| 20–22 | 16.5–18.5 | Above typical; regular training |
| 22–23.5 | 18.5–20 | Muscular; usually years of training |
| 23.5–25 | 20–21.5 | Very muscular; progress is slow |
| 25 and up | 21.5 and up | Exceptional; uncommon without years of training and favorable genetics |
The men’s ranges center on Schutz’s median of 18.9 and top out at Kouri’s 25. The women’s ranges sit about 3.5 points lower, the gap between the male and female medians. The top of the women’s scale is a description, not a ceiling.
FFMI also varies with age and ancestry. In a DXA study of 1,339 adults, FFMI differed between ethnic groups and started declining in the mid-20s for men and mid-40s for women (Hull et al., 2011).
Is an FFMI of 25 the natural limit?
The idea comes from a 1995 study of 157 male athletes. Kouri’s team found that the normalized FFMI of the 74 who had never used steroids topped out at 25.0, while many of the 83 steroid users exceeded it, some above 30. Twenty pre-steroid-era Mr. America winners (1939–1959) averaged an estimated 25.4. The authors called their findings preliminary.
Later research complicates the line:
- In 235 NCAA football players measured by DXA, 26% had a normalized FFMI above 25; the 97.5th percentile was 28.1 (Trexler et al., 2017). College athletes are drug-tested, though testing isn’t perfect, and linemen are heavier and taller than most lifters.
- Different body fat methods disagree. DXA, bioimpedance and skinfold calipers can each give a different fat-free mass for the same person, so FFMIs from different studies aren’t perfectly comparable.
- Small samples miss outliers. A limit seen in 74 people says little about the rare person at the far end of the curve.
The upshot: an FFMI above 25 is uncommon for drug-free lifters, not impossible, and FFMI alone can’t prove anyone’s drug use.
How accurate is FFMI?
The formula is exact arithmetic. The uncertainty comes from your inputs, and body fat dominates.
At 5′10″ and 180 lb, each percentage point of body fat moves FFMI by about 0.26. If your scale says 15% but a DXA scan would say 20%, your FFMI drops from 22.0 to 20.7: a full range on the scale. Calipers, smart scales and visual estimates often disagree by several points.
Height matters too: it’s squared, so being off by an inch shifts raw FFMI by about 0.6 (normalized FFMI by about 0.45). And very lean, very muscular or very tall people sit at the edges of the data most estimates are built on.

Measure for a trustworthy number
- Height. Barefoot, heels, back and head against a wall. Rest a book flat on your head, mark the wall and measure to the floor.
- Weight. In the morning after the bathroom, before eating or drinking, in the same clothes. Weight swings by a few pounds day to day, so average a week of weigh-ins if you can.
- Body fat. Use one method and stick with it. A DXA scan is a common reference method if you have access to one; a tape-measure body fat estimate is free and repeatable. To sanity-check, compare yourself with body fat percentage pictures.
Track FFMI changes over time
FFMI is most useful as a trend. One reading has a wide margin of error; the same method repeated every 8–12 weeks shows whether you’re actually adding lean mass. At 5′10″, one FFMI point is about 7 lb (3.2 kg) of fat-free mass, so expect slow movement: months, not weeks.
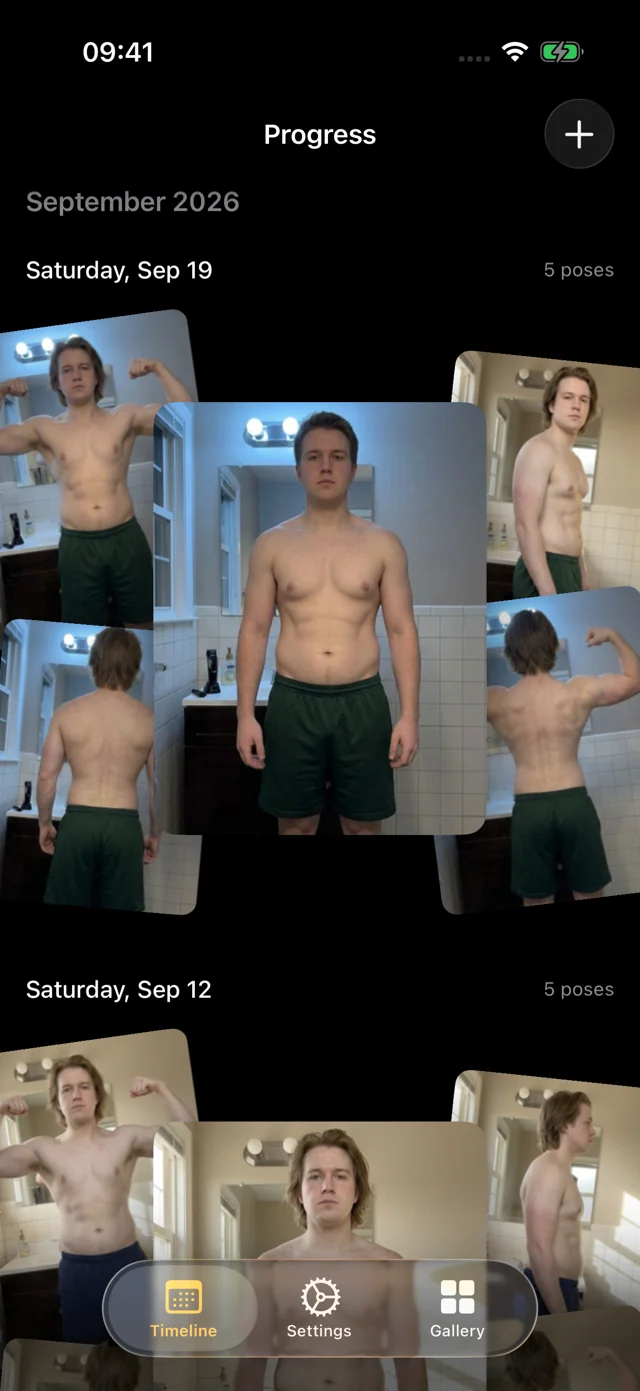
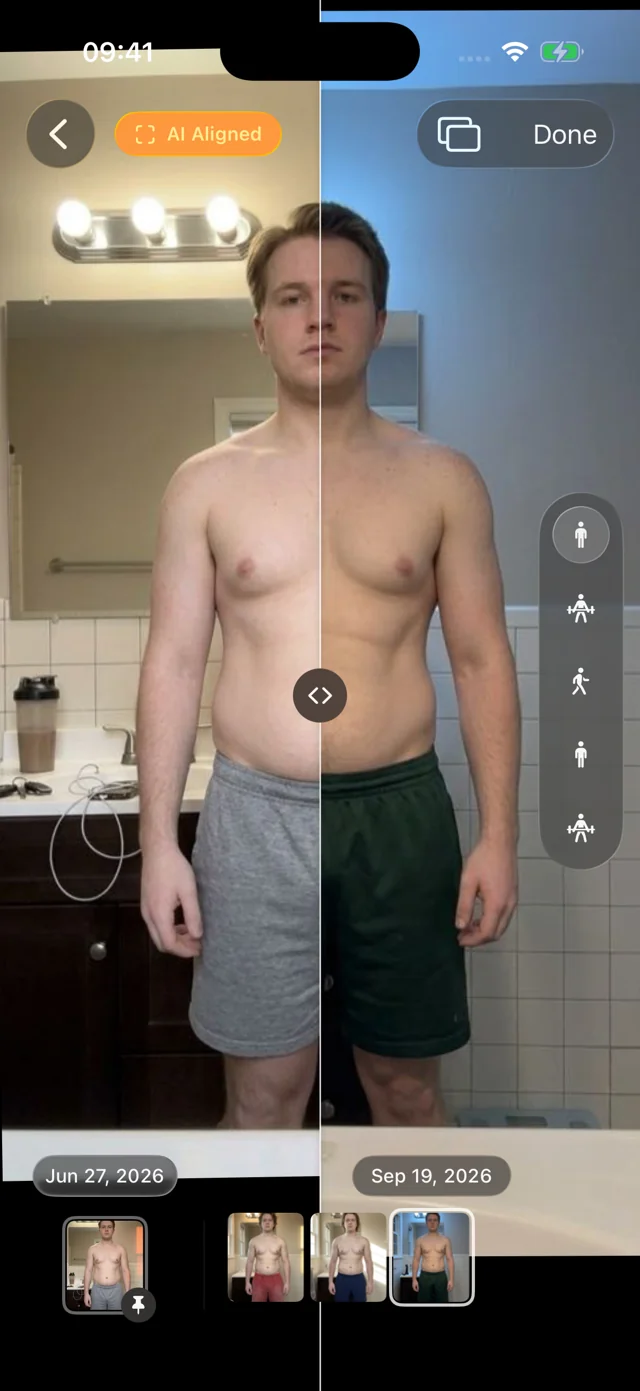
That’s where numbers alone fall short. A body fat reading can wobble by two points overnight, but a consistent set of progress photos shows whether your shoulders, arms and waist are changing. Pair each check-in with photos taken the same way every time, using the progress photo basics. For what lean gains look like when the scale barely moves, see body recomposition before and after, and for realistic pacing, the body transformation timeline.
Progress makes the photo side easy: hands-free capture of five standard poses in about a minute, and every photo AI aligned so you can slide between any two dates and see the change, while your photos never leave your iPhone.
FAQ
What does FFMI mean in fitness?
FFMI stands for fat-free mass index: fat-free mass in kilograms divided by height in meters squared. Lifters use it to describe how muscular someone is for their height, independent of body fat.
What is a good FFMI for a man?
The median for men aged 18–34 is about 18.9. A normalized FFMI of 20–22 is above typical and common among people who train regularly; 22–25 is muscular to very muscular and usually takes years of consistent training.
What is a good FFMI for a woman?
The median for women aged 18–34 is about 15.4. Around 16.5–18.5 is above typical for women who train regularly, and values above 20 are uncommon.
Is FFMI better than BMI?
For muscular people, yes. BMI counts muscle and fat the same, so lifters can register as “overweight.” FFMI removes fat from the equation. But it needs a body fat estimate, which adds error, while BMI only needs height and weight.
Can FFMI tell if someone is on steroids?
No. Kouri’s team proposed FFMI as an initial screen, not proof. Measurement error, genetics and sport can all push a drug-free athlete above 25, as the football data shows.